Monday, November 30, 2015

Internet use and religion, part five

[If you are jumping into the middle of this series, you might want to start with this article, which explains the methodological approach I am taking.]

In the previous article, I show results from two regression models that predict religious affiliation and degree of religiosity.  I use the models to compare hypothetical respondents who are at their national means for all explanatory factors; then I vary one factor at a time, comparing someone at the 25th percentile with someone at the 75th percentile.  I compute the different in the predicted probability of religious affiliation and the predicted level of religiosity:

1) In almost every country, a hypothetical respondent with high Internet use is less likely to report a religious affiliation.  The median effect size across countries is 3.5 percentage points.

2) In almost every country, a hypothetical respondent with high Internet use reports a lower degree of religiosity.  The median effect size is 0.36 points on a 10-point scale.

These results suggest that Internet use might cause religious disaffiliation and decreased religiosity, but they are ambiguous.  It is also possible that the direction of causation is the other way; that is, that religiosity causes a decrease in Internet use.  Or there might be other factors that cause both Internet use and religiosity.

I'll address the first possibility first.  If religiosity causes lower Internet use, we should be able to measure that effect by flipping the models, taking religious affiliation and religiosity as explanatory variables and trying to predict Internet use.

I did that experiment and found:

1) Religious affiliation (hasrelig) has no predictive value for Internet use in most countries, and only weak predictive value in others.

2) Degree of religiosity (rlgdgr) has some predictive value for Internet use in some countries, but the effect is weaker than other explanatory variables (like age and education), and weaker than the effect of Internet use on religiosity: the median across countries is 0.19 points on a 7-point scale.

Considering the two possibilities, that Internet use causes religious disaffiliation or the other way around, these results support the first possibility, although the second might make a smaller contribution.

Although it is still possible that a third factor causes increased Internet use and decreased religious affiliation, it would have to do so in a strangely asymmetric way to account for these results.  And since the model controls for age, income, education, and other media use, this hypothetical third factor would have to be uncorrelated with these controls (or only weakly correlated).

I can't think of any plausible candidates for this third factor.  So I tentatively conclude that Internet use causes decreased religiosity.  I present more detailed results below.

Summary of previous results

In the previous article, I computed an effect size for each factor and reported results for two models, one that predicts hasrelig (whether the respondent reports religious affiliations) and one that predicts rlgdgr (degree of religiosity on a 0-10 scale).  The following two graphs summarize the results.

Each figure shows the distribution of effect size across the 34 countries in the study.  The first figure shows the results for the first model as a difference in percentage points; each line shows the effect size for a different explanatory variable.

The factors with the largest effect sizes are year of birth (dark green line) and Internet use (purple).

For Internet use, a respondent who is average in every way, but falls at the 75th percentile of Internet use, is typically 2-7 percentage points less likely to be affiliated than a similar respondent at the 25th percentile of Internet use.  In a few countries, the effect is apparently the other way around, but in those cases the estimated effect size is not statistically significant.

 Overall, people who use the Internet more are less likely to be affiliated, and the effect is stronger than the effect of education, income, or the consumption of other media.

Similarly, when we try to predict degree of religiosity, people who use the Internet more (again comparing the 75th and 25th percentiles) report lower religiosity, typically 0.2 to 0.7 points on a 10 point scale.  Again, the effect size for Internet use is bigger than for education, income, or other media.
Of course, what I am calling an "effect size" may not be an effect in the sense of cause and effect.  What I have shown so far is that Internet users tend to be less religious, even when we control for other factors.  It is possible, and I think plausible, that Internet use actually causes this effect, but there are two other possible explanations for the observed statistical association:

1) Religious affiliation and religiosity might cause decreased Internet use.
2) Some other set of factors might cause both increased Internet use and decreased religiosity.

Addressing the first alternative explanation, if people who are more religious tend to use the Internet less (other things being equal), we would expect that effect to appear in a model that includes religiosity as an explanatory variable and Internet use as a dependent variable.

But it turns out that if we run these models, we find that religiosity has little power to predict levels of Internet use when we control for other factors.  I present the results below; the details are in this IPython notebook.

Model 1

The first model tries to predict level of Internet use taking religious affiliation (hasrelig) as an explanatory variable, along with the same controls I used before: year of birth (linear and quadratic terms), year of interview, education, income, and consumption of other media.

The following figure shows the effect size of religious affiliation on Internet use.
In most countries it is essentially zero, but in a few countries people who report a religious affiliation also report less Internet use, but always less than 0.5 points on a 7 point scale.

The following figure shows the distribution of effect size for the other variables on the same scale.
If we are trying to predict Internet use for a given respondent, the most useful explanatory variables, in descending order of effect size, are year of birth, education, year of interview, income, and television viewing.  The effect sizes for religious affiliation, radio listening, and newspaper reading are substantially smaller.

The results of the second model are similar.

Model 2

The second model tries to predict level of Internet use taking degree of religiosity (rlgdgr) as an explanatory variable, along with the same controls I used before.

The following figure shows the estimated effect size in each country, showing the difference in Internet use of two hypothetical respondents who are at their national mean for all variables except degree of religiosity, where they are at the 25th and 75th percentiles.

In most countries, the respondent reporting a higher level of religiosity also reports a lower level of Internet use, in almost all cases less than 0.5 points on a 7-point scale.  Again, this effect is smaller than the apparent effect of the other explanatory variables.
Again, the variables that best predict Internet use are year of birth, education, year of interview, income, and television viewing.  The apparent effect of religiosity is somewhat less than television viewing, and more than radio listening and newspaper reading.

Next steps

As I present these results, I realize that I can make them easier to interpret by expressing the effect size in standard deviations, rather than raw differences.  Internet use is recorded on a 7 point scale, and religiosity on a 10 point scale, so its not obvious how to compare them.

Also, variability of Internet use and religiosity is different across countries, so standardizing will help with comparisons between countries, too.

More results in the next installment.


Tuesday, November 24, 2015

Internet use and religion, part four

[If you are jumping into the middle of this series, you might want to start with this article, which explains the methodological approach I am taking.]

In the previous article, I presented preliminary results from a study of relationships between Internet use and religion.  Using data from the European Social Survey, I ran regressions to estimate the effect of media consumption (television, radio, newspapers, and Internet) on religious affiliation and degree of religiosity.

As control variables, I include year born, education and income (expressed as relative ranks within each country) and the year the data were gathered (between 2002 and 2010).

Some of the findings so far:

  1. In almost every country, younger people are less religious.
  2. In most countries, people with more education are less religious.
  3. In about half of the 34 countries, people with lower income are less religious.  In the rest, the effect (if any) is too small to be distinguished from noise with this sample size.
  4. In most countries, people who watch more television are less religious.
  5. In a fewer than half of the countries, people who listen to more radio are less religious.
  6. The results for newspapers are similar: only a few countries show a negative effect, and in some countries the effect is positive.
  7. In almost every country, people who use the Internet are less religious.
  8. There is a weak relationship between the strength of the effect and the average degree of religiosity: the negative effect of Internet use on religion tends to be stronger in more religious countries.
In the previous article, I measured effect size using the parameters of the regression models: for logistic regression, the parameter is a log odds ratio, for linear regression it is a linear weight.  These parameters are not useful for comparing the effects of different factors, because they are not on the same scale, and they are not the best choice for comparing effect size between countries, because they don't take into account variation in each factor in each country.

For example, in one country the parameter associated with Internet use might be small, but if there is large variation in Internet use within the country, the net effect size might be greater than in another country with a larger parameter, but little variation.

Effect size

So my next step is to define effect size in terms that are comparable between factors and between countries.  To explain the methodology, I'll use the logistic model, which predicts the probability of religious affiliation.  I start by fitting the model to the data, then use the model to predict the probability of affiliation for a hypothetical respondent whose values for all factors are the national mean.  Then I vary one factor at a time, generating predictions for hypothetical respondents whose value for one factor is at the 25th percentile (within country) and at the 75th percentile.  Finally, I compute the difference in predicted values in percentage points.

As an example, suppose a hypothetically average respondent has a 45% chance of reporting a religious affiliation, as predicted by the model.  And suppose the 25th and 75th percentiles of Internet use are 2 and 7, on a 7 point scale.  A person who is average in every way, but with Internet use only 2 might have a 47% chance of affiliation.  The same person with Internet use 7 might have a 42% chance.  In that case I would report that the effect size is a difference of 5 percentage points.

As in the previous article, I run this analysis on about 200 iterations of resampled data, then compute a median and 95% confidence interval for each value.


Quadratic age model

Before I get to the results, there is one other change from the previous installment:  I added a quadratic term for year born.  The reason is that in preliminary results, I noticed that Internet had the strongest negative association with religiosity, followed by television, then radio and newspapers.  I wondered whether this pattern might be the result of correlation with age; that is, whether younger people are more likely to consume new media and be less religious.  I was already controlling for age using yrborn60 (year born minus 1960) but I worried that if the relationship with age is nonlinear, I might not be controlling for it effectively.

So I added a quadratic term to the model.  Here are the estimated parameters for the linear term and quadratic term:

In many countries, both parameters are statistically significant, so I am inclined to keep them in the model.  The sign of the quadratic term is usually positive, so the curves are convex up, which suggests that the age effect might be slowing down.

Anyway, including the quadratic term has almost no effect on the other results: the relative strengths of the associations are the same.

Model 1 results

Again, the first model uses logistic regression with dependent variable hasrelig, which indicates whether the respondent reports a religious affiliation.

In the following figures, the x-axis is the percentage point difference in hasrelig between people at the 25th and 75th percentile for each explanatory variable.
 In most countries, people with more education are less religious.
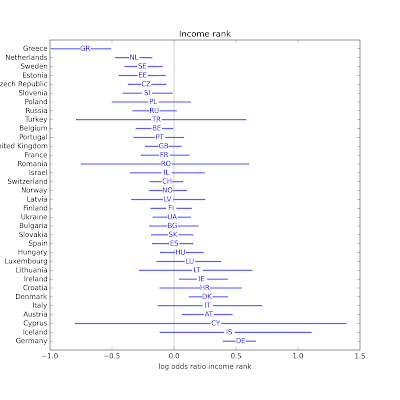
 In most countries, the effect of income is small and not statistically significant.
 The effect of television is negative in most countries.
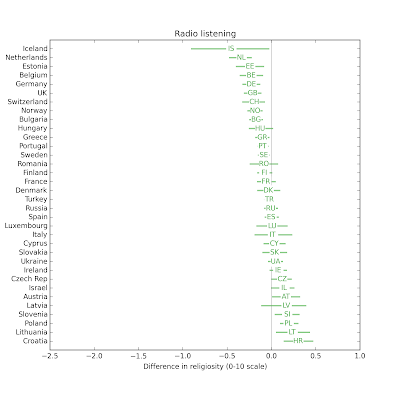
The effect of radio is usually small.
 The effect of newspapers is usually small.
In most countries, Internet use is associated with substantial decreases in religious affiliation.

Pulling together the results so far, the following figure shows the distribution (CDF) of effect size across countries:
 Overall, the effect size for Internet use is the largest, followed by education and television.  The effect sizes for income, radio, and newspaper are all small, and centered around zero.

Model 2 results

The second model uses linear regression with dependent variable rlgdgr, which indicates degree of religiosity on a 0-10 scale.


In the following figures, the x-axis shows the difference in rlgdgr between people at the 25th and 75th percentile for each explanatory variable.

In most countries, people with more education are less religious.
The effect size for income is smaller.
 People who watch more television are less religious.
The effect size for radio is small.
The effect size for newspapers is small.
 In most countries, people who use the Internet more are less religious.
Comparing the effect size for different explanatory variable, again, Internet use has the biggest effect, followed by education and television.  Effect sizes for income, radio, and newspaper are smaller and centered around zero.

That's all for now.  I have a few things to check out, and then I should probably wrap things up.

Thursday, November 19, 2015

Internet use and religion, part three

This article reports preliminary results from an exploration of the relationship between religion and Internet use in Europe, using data from the European Social Survey (ESS).

I describe the data processing pipeline and models in this previous article.  All the code for this article is in this IPython notebook.


Data inventory

The dependent variables I use in the models are

rlgblg: Do you consider yourself as belonging to any particular religion or denomination?

rlgdgr: Regardless of whether you belong to a particular religion, how religious would you say you are?  Scale from 0 = Not at all religious to 10 = Very religious.

The explanatory variables are

yrbrn: And in what year were you born?

hincrank: Household income, rank from 0-1 indicating where this respondent falls relative to respondents from the same country, same round of interviews.

edurank: Years of education, rank from 0-1 indicating where this respondent falls relative to respondents from the same country, same round of interviews.

tvtot: On an average weekday, how much time, in total, do you spend watching television?  Scale from 0 = No time at all to 7 = More than 3 hours.

rdtot: On an average weekday, how much time, in total, do you spend listening to the radio? Scale from 0 = No time at all to 7 = More than 3 hours.

nwsptot: On an average weekday, how much time, in total, do you spend reading the newspapers? Scale from 0 = No time at all to 7 = More than 3 hours.

netuse: Now, using this card, how often do you use the internet, the World Wide Web or e-mail - whether at home or at work - for your personal use?  Scale from 0 = No access at home or work, 1 = Never use, 6 = Several times a week, 7 = Every day.

Model 1: Affiliated or not?

In the first model, the dependent variable is rlgblg, which indicates whether the respondent is affiliated with a religion.

The following figures shows estimated parameters from logistic regression, for each of the explanatory variables.  The parameters are log odds ratios: negative values indicate that the variable decreases the likelihood of affiliation; positive values indicate that it increases the likelihood.

The horizontal lines show the 95% confidence interval for the parameters, which includes the effects of random sampling and filling missing values.  Confidence intervals that cross the zero line indicate that the parameter is not statistically significant at the p<0.05 level.
In most countries, interview year has no apparent effect.  I will probably drop it from the next iteration of the model.
 Year born has a consistent negative effect, indicating that younger people are less likely to be affiliated.  Possible exceptions are Israel, Turkey and Cyprus.
 In most countries, people with more education are less likely to be affiliated.  Possible exceptions: Latvia, Sweden, and the UK.
 In a few countries, income might have an effect, positive or negative.  But it most countries it is not statistically significant.
 It looks like television might have a positive or negative effect in several countries.
 In most countries the effect of radio is not statistically significant.  Possible exceptions are Portugal, Greece, Bulgaria, the Netherlands, Estonia, the UK, Belgium, and Germany.
 In most countries the effect of newspapers is not statistically significant.  Possible exceptions are Turkey, Greece, Italy, Spain, Croatia, Estonia, Portugal and Norway.
 In the majority of countries, Internet use (which includes email and web) is associated with religious disaffiliation.  The estimated parameter is only positive in 4 countries, and not statistically significant in any of them.  The effect of Internet use appears strongest in Poland, Portugal, Israel, and Austria.

The following scatterplot shows the estimated parameter for Internet use on the x-axis, and the fraction of people who report religious affiliation on the y-axis.  There is a weak negative correlation between then (rho = -0.38), indicating that the effect of Internet use is stronger in countries with higher rates of affiliation.

Model 2: Degree of religiosity

In the first model, the dependent variable is rlgdgr, a self-reported degree of religiosity on a 0-10 scale (where 0 = not at all religious and 10 = very religious).

The following figures shows estimated parameters from linear regression, for each of the explanatory variables.  Negative values indicate that the variable decreases the likelihood of affiliation; positive values indicate that it increases the likelihood.

Again, the horizontal lines show the 95% confidence interval for the parameters; intervals that cross the zero line are not statistically significant at the p<0.05 level.
 As in Model 1, interview year is almost never statistically significant.
 Younger people are less religious in every country except Israel.
 In most countries, people with more education are less religious, with possible exceptions Estonia, the UK, and Latvia.
 In about half of the countries, people with higher income are less religious.  One possible exception: Germany.
 In most countries, people who watch more television are less religious.  Possible exceptions: Greece and Italy.
 In several countries, people who listen to the radio are less religious.  Possible exceptions: Slovenia, Austria, Polans, Israel, Croatia, Lithuania.
 In some countries, people who read newspapers more are less religious, but in some other countries they are more religious.
 In almost every country, people who use the Internet more are less religious.  The estimated parameter is only positive in three countries, and none of them are statistically significant.  The effect of Internet use appears to be particularly strong in Israel and Luxembourg.

The following scatterplot shows the estimated parameter for Internet use on the x-axis and the national average degree of religiosity on the y-axis.  Using all data points, the coefficient of correlation is -0.16, but if we exclude the outliers, it is -0.36, indicating that the effect of Internet use is stronger in countries with higher degrees of religiosity.

Next steps

I am working on a second round of visualizations that show the size of the Internet effect in each country, expressed in terms of differences between people at the 25th, 50th, and 75th percentiles of Internet use.

I am also open to suggestions for further explorations.  And if anyone has insight into some of the countries that show up as exceptions to the common patterns, I would be interested to hear it.


Tuesday, November 17, 2015

Internet use and religion, part two

In the previous article, I posted a preliminary exploration of the relationship between Internet use and religious affiliation in Europe.  In this article I clean up some data issues and present results broken by country.

Cleaning and resampling

Here are the steps of the data cleaning pipeline:

  1. I replace sentinel values with NaNs.
  2. I recode some of the explanatory variables, and shift "year born" and "interview year" so their mean is 0.
  3. Within each data collection round and each country, I resample the respondents using their post stratification weights (pspwght). 
  4. In Rounds 1 and 2, there are a few countries that were not asked about Internet use.  I remove these countries from those rounds.
  5. For the variables eduyrs and hinctnta, I replace each value with its rank (from 0-1) among respondents in the same round and country.
  6. I replace missing values with random samples from the same round and country.
  7. Finally, I merge rounds 1-5 into a single DataFrame and then group by country.
This IPython notebook has the details, and summaries of the variables after processing.

One other difference compared to the previous notebook/article: I've added the variable invyr70, which is the year the respondent was interviewed (between 2002 and 2012), shifted by 2007 so the mean is near 0.

Aggregate results

Using variables with missing values filled (as indicated by the _f suffix), I get the following results from logistic regression on rlgblg_f (belonging to a religion), with sample size 233,856:

coefstd errzP>|z|[95.0% Conf. Int.]
Intercept1.10960.01766.3810.0001.077 1.142
inwyr07_f0.04770.00230.7820.0000.045 0.051
yrbrn60_f-0.00900.000-32.6820.000-0.010 -0.008
edurank_f0.01320.0170.7750.438-0.020 0.046
hincrank_f0.07870.0164.9500.0000.048 0.110
tvtot_f-0.01760.002-7.8880.000-0.022 -0.013
rdtot_f-0.01300.002-7.7100.000-0.016 -0.010
nwsptot_f-0.03560.004-9.9860.000-0.043 -0.029
netuse_f-0.10820.002-61.5710.000-0.112 -0.105

Compared to the results from last time, there are a few changes
  1. Interview year has a substantial effect, but probably should not be taken too seriously in this model, since the set of countries included in each round varies.  The apparent effect of time might reflect the changing mix of countries.  I expect this variable to be more useful after we group by country.
  2. The effect of "year born" is similar to what we saw before.  Younger people are less likely to be affiliated.
  3. The effect of education, now expressed in relative terms within each country, is no longer statistically significant.  The apparent effect we saw before might have been due to variation across countries.
  4. The effect of income, now expressed in relative terms within each country, is now positive, which is more consistent with results in other studies.  Again, the apparent negative effect in the previous analysis might have been due to variation across countries (see Simpson's paradox).
  5. The effect of the media variables is similar to what we saw before:  Internet use has the strongest effect, 2-3 times bigger than newspapers, which are 2-3 times bigger than television or radio.  And all are negative.
The inconsistent behavior of education and income as control variables is a minor concern, but I think the symptoms are most likely the result of combining countries, possibly made worse because I am not weighting countries by population, so smaller countries are overrepresented.

Here are the results from linear regression with rlgdgr_f (degree of religiosity) as the dependent variable:

coefstd errtP>|t|[95.0% Conf. Int.]
Intercept6.01400.022270.4070.0005.970 6.058
inwyr07_f0.02530.00212.0890.0000.021 0.029
yrbrn60_f-0.01720.000-46.1210.000-0.018 -0.016
edurank_f-0.24290.023-10.5450.000-0.288 -0.198
hincrank_f-0.15410.022-7.1280.000-0.196 -0.112
tvtot_f-0.07340.003-24.3990.000-0.079 -0.067
rdtot_f-0.01990.002-8.7600.000-0.024 -0.015
nwsptot_f-0.07620.005-15.6730.000-0.086 -0.067
netuse_f-0.13740.002-57.5570.000-0.142 -0.133
In this model, all parameters are statistically significant.  The effect of the media variables, including Internet use, is similar to what we saw before.

The effect of education and income is negative in this model, but I am not inclined to take it too seriously, again because we are combining countries in a way that doesn't mean much.

Breakdown by country

The following table shows results for logistic regression, with rlgblg_f as the dependent variable, broken down by country; the columns are country code, number of observations, and the estimated parameter associated with Internet use:

Country Num      Coef of     
code    obs.     netuse_f
------- ----     --------
AT 6918 -0.0795 **
BE 8939 -0.0299 **
BG 6064 0.0145
CH 9310 -0.0668 **
CY 3293 -0.229 **
CZ 8790 -0.0364 **
DE 11568 -0.0195 *
DK 7684 -0.0406 **
EE 6960 -0.0205
ES 9729 -0.0741 **
FI 7969 -0.0228
FR 5787 -0.0185
GB 11117 -0.0262 **
GR 9759 -0.0245
HR 3133 -0.0375
HU 7806 -0.0175
IE 10472 -0.0276 *
IL 7283 -0.0636 **
IS 579 0.0333
IT 1207 -0.107 **
LT 1677 -0.0576 *
LU 3187 -0.0789 **
LV 1980 -0.00623
NL 9741 -0.0589 **
NO 8643 -0.0304 **
PL 8917 -0.108 **
PT 10302 -0.103 **
RO 2146 0.00855
RU 7544 0.00437
SE 9201 -0.0374 **
SI 7126 -0.0336 **
SK 6944 -0.0635 **
TR 4272 -0.0857 *
UA 7809 -0.0422 **

** p < 0.01, * p < 0.05

In the majority of countries, there is a statistically significant relationship between Internet use and religious affiliation.  In all of those countries the relationship is negative, with the magnitude of most coefficients between 0.03 and 0.11 (with one exceptionally large value in Cyprus).

Degree of religiosity

And here are the results of linear regression, with rlgdgr_f as the dependent variable:

Country Num      Coef of     
code    obs.     netuse_f
------- ----     --------
AT 6918 -0.0151     **
BE 8939 -0.0072     **
BG 6064  0.0023    
CH 9310 -0.0132     **
CY 3293 -0.00221     **
CZ 8790 -0.005     **
DE 11568 -0.0045     *
DK 7684 -0.00909     **
EE 6960 -0.00363    
ES 9729 -0.0165     **
FI 7969 -0.00501    
FR 5787 -0.00429    
GB 11117 -0.0061     **
GR 9759 -0.00362     **
HR 3133 -0.00559    
HU 7806 -0.00478     *
IE 10472 -0.00412     *
IL 7283 -0.00419     **
IS 579  0.00752    
IT 1207 -0.0212     **
LT 1677 -0.00746    
LU 3187 -0.0152     **
LV 1980 -0.00147    
NL 9741 -0.014     **
NO 8643 -0.00721     **
PL 8917 -0.00919     **
PT 10302 -0.0149     **
RO 2146  0.000303    
RU 7544  0.00102    
SE 9201 -0.00815     **
SI 7126 -0.00835     **
SK 6944 -0.0119     **
TR 4272 -0.00331     **
UA 7809 -0.00947     **

In most countries there is a negative and statistically significant relationship between Internet use and degree of religiosity.

In this model the effect of education is consistent: in most countries it is negative and statistically significant.  In the two countries where it is positive, it is not statistically significant.

The effect of income is less consistent: in most countries it is not statistically significant; when it is, it is positive as often as negative.

But education and income are in the model primarily as control variables; they are not the focus on this study.  If they are actually associated with religious affiliation, these variables should be effective controls; if not, they contribute some noise, but otherwise do no harm.

Next steps

For now I am using StatsModels to estimate parameters and compute confidence intervals, but that's not quite right because I am using resampled data and filling missing values with random samples.  To account correctly for these sources of random error, I have to run the whole process repeatedly:
  1. Resample the data.
  2. Fill missing values.
  3. Estimate parameters.
Collecting the estimated parameters from multiple runs, I can estimate the sampling distribution of the parameters and compute confidence intervals.

Once I have implemented that, I plan to translate the results into a form that is easier to interpret (rather than just estimated coefficients), and generate visualizations to make the results easier to explore.

I would also like to relate the effect of Internet use in each country with the average level of religiosity, to see whether, for example, the effect is bigger in more religious countries.

While I am working on that, I am open to suggestions for additional explorations people might be interested in.  You can explore the variables in the ESS using their "Cumulative Data Wizard"; let me know what you find!