This is an extended version of my article in the Scientific American blog.
The data I used and all of my code are available in this Jupyter notebook.
The data I used and all of my code are available in this Jupyter notebook.
Secularization in the Unites States
For more than a century religion in the the United States has defied gravity. According to the Theory of Secularization, as societies become more modern, they become less religious. Aspects of secularization include decreasing participation in organized religion, loss of religious belief, and declining respect for religious authority.
Until recently the United States has been a nearly unique counterexample, so I would be a fool to join the line of researchers who have predicted the demise of religion in America. Nevertheless, I predict that secularization in the U.S. will accelerate in the next 20 years.
Using data from the General Social Survey (GSS), I quantify changes since the 1970s in religious affiliation, belief, and attitudes toward religious authority, and present a demographic model that generates predictions.
Summary of results
Religious affiliation is changing quickly:
- The fraction of people with no religious affiliation has increased from less than 10% in the 1990s to more than 20% now. This increase will accelerate, overtaking Catholicism in the next few years, and probably replacing Protestantism as the largest religious affiliation within 20 years.
- Protestantism has been in decline since the 1980s. Its population share dropped below 50% in 2012, and will fall below 40% within 20 years.
- Catholicism peaked in the 1980s and will decline slowly over the next 20 years, from 24% to 20%.
- The share of other religions increased from 4% in the 1970s to 6% now, but will be essentially unchanged in the next 20 years.
Religious belief is in decline, as well as confidence in religious institutions:
- The fraction of people who say they “know God really exists and I have no doubts about it” has decreased from 64% in the 1990s to 58% now, and will approach 50% in the next 20 years.
- At the same time the share of atheists and agnostics, based on self-reports, has increased from 6% to 10%, and will reach 14% around 2030.
- Confidence in the people running organized religions is dropping rapidly: the fraction who report a “great deal” of confidence has dropped from 36% in the 1970s to 19% now, while the fraction with “hardly any” has increased from 17% to 26%. At 3-4 percentage points per decade, these are among the fastest changes we expect to see in this kind of data.
- Interpretation of the Christian Bible has changed more slowly: the fraction of people who believe the Bible is “the actual word of God and is to be taken literally, word for word” has declined from 36% in the 1980s to 32% now, little more than 1 percentage point per decade.
- At the same time the number of people who think the Bible is “an ancient book of fables, legends, history and moral precepts recorded by man” has nearly doubled, from 13% to 22%. This skepticism will approach 30%, and probably overtake the literal interpretation, within 20 years.
Predictive demography
Let me explain where these predictions come from. Since 1972 NORC at the University of Chicago has administered the General Social Survey (GSS), which surveys 1000-2000 adults in the U.S. per year. The survey includes questions related to religious affiliation, attitudes, and beliefs.
Regarding religious affiliation, the GSS asks “What is your religious preference: is it Protestant, Catholic, Jewish, some other religion, or no religion?” The following figure shows the results, with a 90% interval that quantifies uncertainty due to random sampling.

This figure provides an overview of trends in the population, but it is not easy to tell whether they are accelerating, and it does not provide a principled way to make predictions. Nevertheless, demographic changes like this are highly predictable (at least compared to other kinds of social change).
Religious beliefs and attitudes are primarily determined by the environment people grow up in, including their family life and wider societal influences. Although some people change religious affiliation later in life, most do not, so changes in the population are largely due to generational replacement.
We can get a better view of these changes if we group people by their year of birth, which captures information about the environment they grew up in, including the probability that they were raised in a religious tradition and their likely exposure to people of other religions. The following figure shows the results:
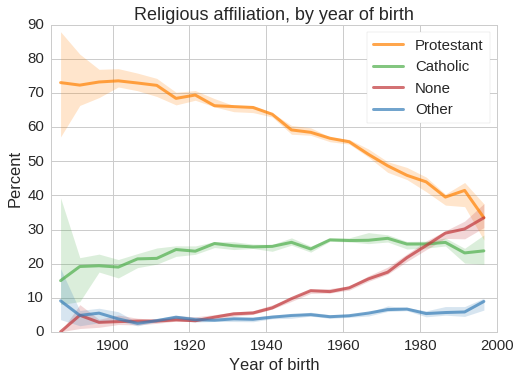
Among people born before 1940, a large majority are Protestant, only 20-25% are Catholic, and very few are Nones or Others. These numbers have changed radically in the last few generations: among people born since 1980, there are more Nones than Catholics, and among the youngest adults, there may already be more Nones than Protestants.
However, this view of the data can be misleading. Because these surveys were conducted between 1972 and the present, we observe different birth cohorts at different ages. People born in 1900 were surveyed in their 70s and 80s, whereas people born in 1998 have only been observed at age 18. If people tend to drift toward, or away from, religion as they age, we would have a biased view of the cohort effect.
Fortunately, with observations over more than 40 years, the design of the GSS makes it possible to estimate the effects of birth year and age simultaneously, using a regression model. Then we can simulate the results of future surveys. Here’s how:
- Each year, the GSS recruits a sample intended to represent the adult U.S. population, so the age range of the respondents is nearly the same every year. We assume the set of ages will be the same for future surveys.
- Given the ages of hypothetical future respondents, we infer their years of birth. For example, if we survey a 40-year-old in 2020, we know they were born in 1980.
- Given ages and years of birth, we use the regression model to predict the probability that each respondent will report being Protestant, Catholic, Other, or None.
- Then we use these probabilities to simulate survey results and predict the fraction of respondents in each group.
The following figure shows the results, with 90% intervals that represent uncertainty due to random sampling in the dataset and random variation in the simulations.
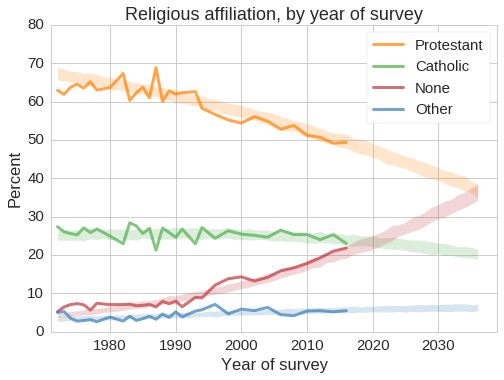
Over the next 20 years, the fraction of Protestants (including non-Catholic Christians) will decline quickly, falling below 40% around 2030. The fraction of Catholics will decline more slowly, approaching 20%. The fraction of other religions might increase slightly.
The fraction of “Nones” will increase quickly, overtaking Catholics in the next few years, and possibly becoming the largest religious group in the U.S. by 2036.
Are these predictions credible?
To see how reliable these predictions are, we can use past data to predict the present. Supposing it’s 2006, and disregarding data from after 2006, the following figure shows the predictions we would make:
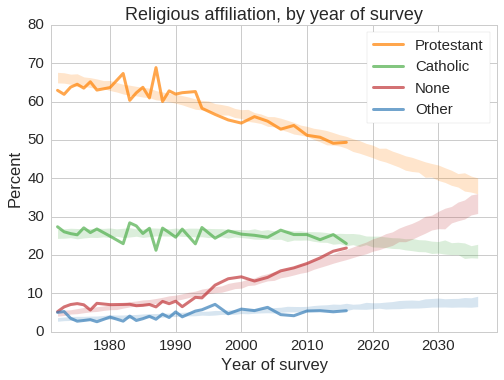
As it turns out, we would have been pretty much right, although we might have underpredicted the growth of the Nones.
Another reason to believe these predictions is that the events they predict have, in some sense, already happened. The people who will be 40 years old in 2036 are 20 now, and we already have data about them. The people who will be 20 in 2036 have already been born.
These predictions will be wrong if current teenagers are more religious than people in their 20s, or if current children are being raised in a more religious environment. But if those things were happening, we would probably know.
In fact, these predictions are likely to be conservative:
- Survey results like these are notoriously subject to social desirability bias, which is the tendency of respondents to shade their answers in the direction they think is more socially acceptable. To the degree that disaffiliation is stigmatized, we expect these reports to underestimate the number of Nones.
- The trend lines for Protestant and None have apparent points of inflection near 1990. If we use only data since 1990 to build the model, we expect the Nones to reach 40% within 20 years.
Changes in religious belief
As affiliation with organized religion has declined, changes in religious belief have been relatively unchanged, a pattern that has been summarized as “believing without belonging”. However there is evidence that believing will catch up with belonging over the next 20 years.
The GSS asks respondents, “Which statement comes closest to expressing what you believe about God?”
- I don't believe in God
- I don't know whether there is a God and I don't believe there is any way to find out
- I don't believe in a personal God, but I do believe in a Higher Power of some kind
- I find myself believing in God some of the time, but not at others
- While I have doubts, I feel that I do believe in God
- I know God really exists and I have no doubts about it
To make the number of categories more manageable, I classify responses 1 and 2 as “no belief”, responses 3, 4, and 5 as “belief”, and response 6 as “strong belief”.
The following figure shows how belief in God varies with year of birth.
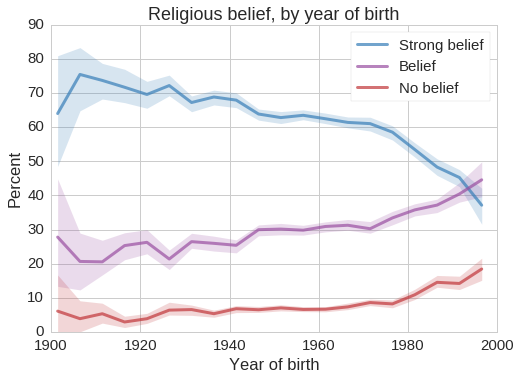
Among people born before 1940, more than 70% profess strong belief in God, but this confidence is in decline; among young adults fewer than 40% are so certain, and nearly 20% are either atheist or agnostic.
Again, we can use these results to model the effect of birth year and age, and use the model to generate predictions. The following figure shows the results:
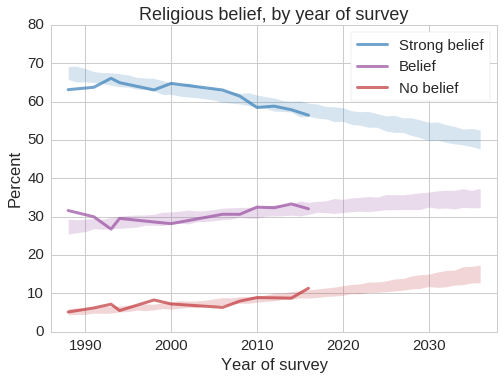
This question was added to the survey in 1988, and it has not been asked every year, so we have less data to work with. Nevertheless, it is clear that strong belief in God is declining and being replaced by weaker forms of belief and non-belief.
Due to social desirability bias we can’t be sure what part of these trends is due to actual changes in belief, and how much might be the result of weakening stigmas against apostasy and atheism. Regardless, these results indicate changes in what people say they believe.
Respect for religious authority
The GSS asks respondents, “As far as the people running [organized religion] are concerned, would you say you have a great deal of confidence, only some confidence, or hardly any confidence at all in them?”
The following figure shows how respect for religious authority varies with year of birth.

Among people born before 1940, 30 to 50% reported a “great deal” of confidence in the people running religious institutions. Among young adults, this has dropped to 20%, and more than 25% now report “hardly any confidence at all”.
These changes have been going on for decades, and seem to be unrelated to specific events. The following figures shows responses to the same question by year of survey. The Catholic Church sexual abuse cases, which received widespread media attention starting in 1992, have no clear effect on the trends; if anything, confidence in religious institutions increased during the 1990s.
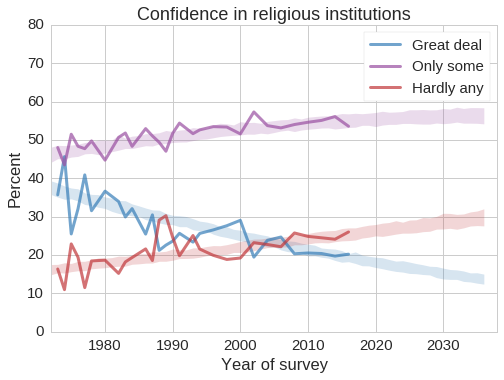
Predictions based on generational replacement suggest that these trends will continue. Within 20 years, the fraction of people with hardly any confidence in religious institutions will approach 30%.
Interpretation of the Bible
The GSS asks, “Which one of these statements comes closest to describing your feelings about the Bible?”
- The Bible is the actual word of God and is to be taken literally, word for word.
- The Bible is the inspired word of God but not everything should be taken literally, word for word.
- The Bible is an ancient book of fables, legends, history and moral precepts recorded by man.
Responses to this question depend strongly on the respondents’ year of birth:

Among people born before 1940, more than 40% say they believe in a literal interpretation of the Christian Bible, and fewer than 15% consider it a collection of fables and legends. Among young adults, these proportions have converged near 25%.
The number of people who believe that the Bible is the inspired word of God, but should not be interpreted literally, has been near 50% for several generations. But this apparent equilibrium might mask two underlying trends: an increase due to transitions from literal to figurative interpretation, and a decrease due to transitions from “inspired” to “legends”.
The following figure shows responses to the same question over time, with predictions.
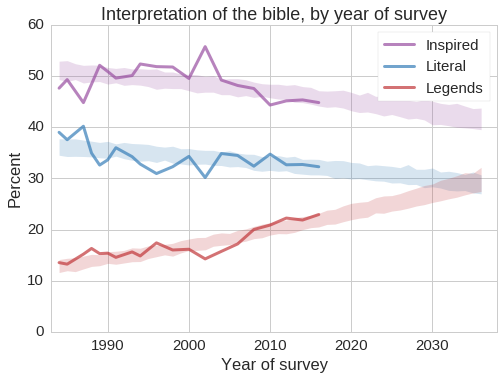
In the next 20 years, people who consider the Bible the literal or inspired word of God will be replaced by people who consider it a collection of ordinary documents, but this transition will be slow.
Again, these responses are susceptible to social desirability bias, so they may not reflect true beliefs accurately. But they reflect changes in what people say they believe, which might cause a feedback effect: as more people express their non-belief, stigmas around atheism will decline, and these trends may accelerate.