Tuesday, February 27, 2018

Support for gun control is lower among young adults

In current discussions of gun policies, many advocates of gun control talk as if time is on their side; that is, they assume that young people are more likely than old people to support gun control.

This letter to the editor of the Economist summarizes the argument:
It is unlikely that a generation raised on lockdown drills, with access to phone footage of gun rampages and a waning interest in hunting, will grow up parroting the National Rifle Association’s rhetoric as enthusiastically as today's political leaders. Change is coming.
And in a recent television interview, a survivor of the Parkland school shooting told opponents of gun control:
You might as well stop now, because we are going to outlive you.
But these assumptions turn out to be false.  In fact, young adults are substantially less likely to support gun control than previous generations.

The following figure shows results I generated from the General Social Survey (GSS) and the CIRP Freshman Survey, plotting support for gun control by year of birth.

The blue line shows the fraction of respondents in the GSS who answered "Favor" to the following question:
Would you favor or oppose a law which would require a person to obtain a police permit before he or she could buy a gun?
Among people born before 1980, support for this form of gun control is strong: around 75% for people born between 1910 and 1940, and approaching 80% for people born between 1950 and 1980.

But among people born in the 1980s and 90s, support for gun control is below 70%.

The orange line shows the fraction of respondents to the CIRP Freshman Survey who "Agree" or "Strongly agree" that
The federal government should do more to control the sale of handguns.
This dataset does not go back as far, but shows the same pattern: a large majority of people born before 1980 supported gun control (when they were surveyed as college freshmen); among people born after 1980, far fewer support gun control.


Other studies

I am not the only one to notice these patterns.  This Vox article from last week reports on similar results from a 2015 Pew Survey and a 2015 Gallup Poll.

The Pew survey found that young adults are less likely than other age groups to support a ban on assault weapons (although they are also more likely to support a federal database of gun sales, and not substantially different from other age groups on some other policy proposals):


This page from the Pew Research Center shows responses to the question
What do you think is more important – to protect the right of Americans to own guns, OR to control gun ownership?
Here are the results:


Before 2007, young adults were the least likely group to choose gun rights over gun control (see the orange line).  Since then, successive cohorts of young adults have shifted substantially away from gun control.

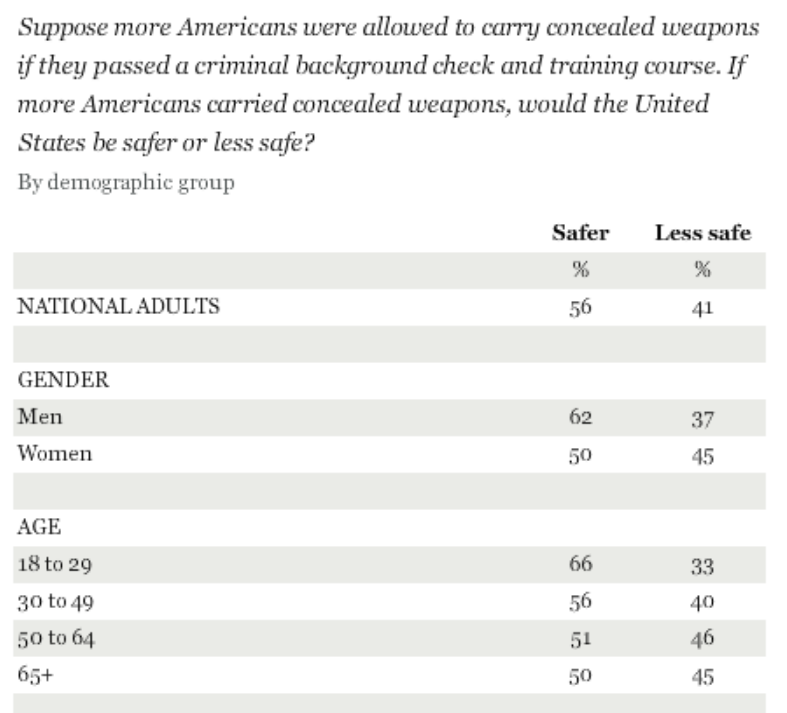
This Gallup poll shows that current young adults are more likely than previous generations to believe that more concealed weapons would make the U.S. safer:


Each of these sources is based on different questions asked of different groups, but they show remarkably consistent results.

The GSS is based on a representative sample of the adult U.S. population.  It includes people of different ages, so it provides insight into the effect of birth year and age.  The Freshman Survey includes only first-year college students, so it is not representative of the general population.  But because all respondents are observed at the same age, it gives the clearest picture of generational changes.

The NRA regime

A possible explanation for these changes is that since the NRA created its lobbying branch in 1975 and its political action committee in 1976, it has succeeded in making gun rights (and opposition to gun control) part of the conservative identity.

We should expect their efforts to have the biggest effect on the generation raised in the 1980s and 90s, and we should expect them to have a stronger effect on conservatives than liberals.

The following figure shows the same data from the GSS, grouped by political self-identification:

As expected, support for gun control has dropped most among people who identify as conservative.

Among moderates, it might have dropped, but not by as much.  The last data point, for people born around 1995, might be back up, but it is based on a small sample, and may not be reliable.

Support among liberals has been mostly unchanged, except for the last point in the series which, again, may not be reliable, as indicated by the wide error bars.

These results suggest that the decrease in support for gun control has been driven primarily by changing views among young conservatives.

UPDATE: NPR has a related story from a few days ago.  They report that "Millennials are no more liberal on gun control than their parents or grandparents — despite diverging from their elders on the legalization of marijuana, same-sex marriage and other social issues." 


Friday, February 23, 2018

The six stages of computational science

This is the second in a series of articles related to computational science and education.  The first article is here.

The Six Stages of Computational Science

When I was in grad school, I collaborated with a research group working on computational fluid dynamics.  They had accumulated a large, complex code base, and it was starting to show signs of strain.  Parts of the system, written by students who had graduated, had become black magic: no one knew how they worked, and everyone was afraid to touch them.  When new students joined the group, it took longer and longer for them to get oriented.  And everyone was spending more time debugging than developing new features or generating results.

When I inspected the code, I found what you might expect: low readability, missing documentation, large functions with complex interfaces, poor organization, minimal error checking, and no automated tests.  In the absence of version control, they had many versions of every file, scattered across several machines.

I'm not sure if anyone could have helped them, but I am sure I didn't.  To be honest, my own coding practices were not much better than theirs, at the time.

The problem, as I see it now, is that we were caught in a transitional form of evolution: the nature of scientific computing was changing quickly; professional practice, and the skills of the practitioners, weren't keeping up.

To explain what I mean, I propose a series of stages describing practices for scientific computing.
  • Stage 1, Calculating:  Mostly plugging numbers into into formulas, using a computer as a glorified calculator.
  • Stage 2, Scripting: Short programs using built in functions, mostly straight line code, few user-defined functions.
  • Stage 3, Hacking: Longer programs with poor code quality, usually lacking documentation.
  • Stage 4, Coding: Good quality code which is readable, demonstrably correct, and well documented.
  • Stage 5, Architecting: Code organized in functions, classes (maybe), and libraries with well designed APIs.
  • Stage 6, Engineering: Code under version control, with automated tests, build automation, and configuration management.
These stages are, very roughly, historical.  In the earliest days of computational science, most projects were at Stages 1 and 2.  In the last 10 years, more projects are moving into Stages 4, 5, and 6.  But that project I worked on in grad school was stuck at Stage 3.

The Valley of Unreliable Science

These stages trace a U-shaped curve of reliability:


By "reliable", I mean science that provides valid explanations, correct predictions, and designs that work.


At Stage 1, Calculating, the primary scientific result is usually analytic.  The correctness of the result is demonstrated in the form of a proof, using math notation along with natural and technical language.  Reviewers and future researchers are expected to review the proof, but no one checks the calculation.  Fundamentally, Stage 1 is no different from pre-computational, analysis-based science; we should expect it to be as reliable as our ability to read and check proofs, and to press the right buttons on a calculator.


At Stage 2, Scripting, the primary result is still analytic, the supporting scripts are simple enough to be demonstrably correct, and the libraries they use are presumed to be correct.

But Stage 2 scripts are not always made available for review, making it hard to check their correctness or reproduce their results.  Nevertheless, Stage 2 was considered acceptable practice for a long time; and in some fields, it still is.


Stage 3, Hacking, has the same hazards as Stage 2, but at a level that's no longer acceptable.  Small, simple scripts tend to grow into large, complex programs.  Often, they contain implementation details that are not documented anywhere, and there is no practical way to check their correctness.


Stage 3 is not reliable because it is not reproducible. Leek and Peng define reproducibility as "the ability to recompute data analytic results given an observed dataset and knowledge of the data analysis pipeline."


Reproducibility does not guarantee reliability, as Leek and Peng acknowledge in the title of their article, "Reproducible research can still be wrong". But without reproducibility as a requirement of published research, there is no way to be confident of its reliability.


Climbing out of the valley

Stages 4, 5, and 6 are the antidote to Stage 3.  They describe what's needed to make computational science reproducible, and therefore more likely to be reliable.

At a minimum, reviewers of a publication and future researchers should be able to:

1) Download all data and software used to generate the results.

2) Run tests and review source code to verify correctness.

3) Run a build process to execute the computation.

To achieve these goals, we need the tools of software engineering:

1) Version control makes it possible to maintain an archived version of the code used to produce a particular result.  Examples include Git and Subversion.

2) During development, automated tests make programs more likely to be correct; they also tend to improve code quality.  During review, they provide evidence of correctness, and for future researchers they provide what is often the most useful form of documentation.  Examples include unittest and nose for Python and JUnit for Java.

3) Automated build systems document the high-level structure of a computation: which programs process which data, what outputs they produce, etc.  Examples include Make and Ant.

4) Configuration management tools document the details of the computational environment where the result was produced, including the programming languages, libraries, and system-level software the results depend on.  Examples include package managers like Conda that document a set of packages, containers like Docker that also document system software, and virtual machines that actually contain the entire environment needed to run a computation.

These are the ropes and grappling hooks we need to climb out of the Valley of Unreliable Science.

Unfortunately, most people working in computational science did not learn these tools in school, and they are not easy to learn.  For example, Git, which has emerged as the dominant version control system, is notoriously hard to use.  Even with GitHub and graphical clients, it's still hard.  We have a lot of work to do to make these tools better.

Nevertheless, it is possible to learn basic use of these tools with a reasonable investment of time.  Software Carpentry offers a three hour workshop on Git and a 4.5 hour workshop on automated build systems.  You could do both in a day (although I'm not sure I'd recommend it).

Implications for practitioners

There are two ways to avoid getting stuck in the Valley of Unreliable Science:

1) Navigate Through It: One common strategy is to start with simple scripts; if they grow and get too complex, you can improve code quality as needed, add tests and documentation, and put the code under version control when it is ready to be released.

2) Jump Over It: The alternative strategy is to maintain good quality code, write documentation and tests along with the code (or before), and keep all code under version control.

Naively, it seems like Navigating is better for agility: when you start a new project, you can avoid the costs of over-engineering and test ideas quickly.  If they fail, they fail fast; and if they succeed, you can add elements of Stages 4, 5, and 6 on demand.

Based on that thinking, I used to be a Navigator, but now I am a Jumper.  Here's what changed my mind:

1) The dangers of over-engineering during the early stages of a project are overstated.  If you are in the habit of creating a new repository for each project (or creating a directory in an existing repository), and you start with a template project that includes a testing framework, the initial investment is pretty minimal.  It's like starting every program with a copy of "Hello, World".

2) The dangers of engineering too late are much greater: if you don't have tests, it's hard to refactor code; if you can't refactor, it's hard to maintain code quality; when code quality degrades, debugging time goes up; and if you don't have version control, you can't revert to a previous working (?) version.

3) Writing documentation saves time you would otherwise spend trying to understand code.

4) Writing tests saves time you would otherwise spend debugging.

5) Writing documentation and tests as you go along also improves software architecture, which makes code more reusable, and that saves time you (and other researchers) would otherwise spend reimplementing the wheel.

6) Version control makes collaboration more efficient.  It provides a record of who changed what and when, which facilitates code and data integrity.  It provides mechanisms for developing new code without breaking the old.  And it provides a better form of file backup, organized in coherent changes, rather than by date.

Maybe surprisingly, using software engineering tools early in a project doesn't hurt agility; it actually facilitates it.

Implications for education

For computational scientists, I think it's better to jump over the Valley of Unreliable Science than try to navigate through it.  So what does that imply for education?  Should we teach the tools and practices of software engineering right from the beginning?  Or do students have to spend time navigating the Valley before they learn to jump over it?

I'll address these questions in the next article.

Friday, February 16, 2018

Learning to program is getting harder

I have written several books that use Python to explain topics like Bayesian Statistics and Digital Signal Processing.  Along with the books, I provide code that readers can download from GitHub.  In order to work with this code, readers have to know some Python, but that's not enough.  They also need a computer with Python and its supporting libraries, they have to know how to download code from GitHub, and then they have to know how to run the code they downloaded.

And that's where a lot of readers get into trouble.

Some of them send me email.  They often express frustration, because they are trying to learn Python, or Bayesian Statistics, or Digital Signal Processing.  They are not interested in installing software, cloning repositories, or setting the Python search path!

I am very sympathetic to these reactions.  And in one sense, their frustration is completely justified:  it should not be as hard as it is to download a program and run it.

But sometimes their frustration is misdirected.  Sometimes they blame Python, and sometimes they blame me.  And that's not entirely fair.

Let me explain what I think the problems are, and then I'll suggest some solutions (or maybe just workarounds).

The fundamental problem is that the barrier between using a computer and programming a computer is getting higher.

When I got a Commodore 64 (in 1982, I think) this barrier was non-existent.  When you turned on the computer, it loaded and ran a software development environment (SDE).  In order to do anything, you had to type at least one line of code, even if all it did was another program (like Archon).

Since then, three changes have made it incrementally harder for users to become programmers

1) Computer retailers stopped installing development environments by default.  As a result, anyone learning to program has to start by installing an SDE -- and that's a bigger barrier than you might expect.  Many users have never installed anything, don't know how to, or might not be allowed to.  Installing software is easier now than it used to be, but it is still error prone and can be frustrating.  If someone just wants to learn to program, they shouldn't have to learn system administration first.

2) User interfaces shifted from command-line interfaces (CLIs) to graphical user interfaces (GUIs).  GUIs are generally easier to use, but they hide information from users about what's really happening.  When users really don't need to know, hiding information can be a good thing.  The problem is that GUIs hide a lot of information programmers need to know.  So when a user decides to become a programmer, they are suddenly confronted with all the information that's been hidden from them.  If someone just wants to learn to program, they shouldn't have to learn operating system concepts first.

3) Cloud computing has taken information hiding to a whole new level.  People using web applications often have only a vague idea of where their data is stored and what applications they can use to access it.  Many users, especially on mobile devices, don't distinguish between operating systems, applications, web browsers, and web applications.  When they upload and download data, they are often confused about where is it coming from and where it is going.  When they install something, they are often confused about what is being installed where.

For someone who grew up with a Commodore 64, learning to program was hard enough.  For someone growing up with a cloud-connected mobile device, it is much harder.

Well, what can we do about that?  Here are a few options (which I have given clever names):

1) Back to the future: One option is to create computers, like my Commodore 64, that break down the barrier between using and programming a computer.  Part of the motivation for the Raspberry Pi, according to Eben Upton, is to re-create the kind of environment that turns users into programmers.

2) Face the pain: Another option is to teach students how to set up and use a software development environment before they start programming (or at the same time).

3) Delay the pain: A third option is to use cloud resources to let students start programming right away, and postpone creating their own environments.

In one of my classes, we face the pain; students learn to use the UNIX command line interface at the same time they are learning C.  But the students in that class already know how to program, and they have live instructors to help out.

For beginners, and especially for people working on their own, I recommend delaying the pain.  Here are some of the tools I have used:

1) Interactive tutorials that run code in a browser, like this adaptation of How To Think Like a Computer Scientist;

2) Entire development environments that run in a browser, like PythonAnywhere; and

3) Virtual machines that contain complete development environments, which users can download and run (providing that they have, or can install, the software that runs the virtual machine).

4) Services like Binder that run development environments on remote servers, allowing users to connect using browsers.

On various projects of mine, I have used all of these tools.  In addition to the interactive version of "How To Think...", there is also this interactive version of Think Java, adapted and hosted by Trinket.

In Think Python, I encourage readers to use PythonAnywhere for at least the first four chapters, and then I provide instructions for making the transition to a local installation.

I have used virtual machines for some of my classes in the past, but recently I have used more online services, like this notebook from Think DSP, hosted by O'Reilly Media.  And the repositories for all of my books are set up to run under Binder.

These options help people get started, but they have limitations.  Sooner or later, students will want or need to install a development environment on their own computers.  But if we separate learning to program from learning to install software, their chances of success are higher.

UPDATE: Nick Coghlan suggests a fourth option, which I might call Embrace the Future: Maybe beginners can start with cloud-based development environments, and stay there.


UPDATE: Thank you for all the great comments!  My general policy is that I will publish a comment if it is on topic, coherent, and civil.  I might not publish a comment if it seems too much like an ad for a product or service.  If you submitted a comment and I did not publish it, please consider submitting a revision.  I really appreciate the wide range of opinion in the comments so far.


Thursday, February 8, 2018

Build your own SOTU

In the New York Time on Tuesday, John McWhorter argues that Donald Trump's characteristic speech patterns are not, as some have suggested, evidence of mental decline.  Rather, the quality of Trump's public speech has declined because, according to McWhorter:

1) "The younger Mr. Trump [...] had a businessman’s normal inclination to present himself in as polished a manner as possible in public settings", and 

2)  The older Trump has "settled into his normal" because as president, he "has no impetus to speak in a way unnatural to him in public".

It's an interesting article, and I encourage you to read it before I start getting silly about it.

I would like to suggest an alternative interpretation, which is that the older Trump's speech sounds as it does because it is being generated by a Markov chain.

A Markov chain is a random process that generates a sequence of tokens; in this case, the tokens are words.  I explain the details below, but first I want to show some results.  Compare these two paragraphs:
"You know, if you're a conservative Republican, if I were a liberal, if, like, okay, if I ran as a liberal Democrat, they would say I'm one of the smartest people anywhere in the world – it’s true! – but when you're a conservative Republican they try – oh, they do a number"
"I mean—think of this—I hate to say it but it’s the same wall that we’re always talking about. It’s—you know, wherever we need, we don’t make a good chance to make a deal on DACA, I really have gotten to like. And I know it’s a hoax."
One of those paragraphs was generated by a Markov chain I trained with the unedited transcript from this recent interview with the Wall Street Journal.  The other was generated by Donald Trump.  Can you tell which is which?

Ok, let's make it a little harder.  Here are ten examples: some are from Trump, some are from Markov.  See if you can tell which are which.

1) I would have said it’s all in the messenger; fellas, and it is fellas because, you know, they don’t, they haven’t figured that the women are smarter right now than the men, so, you know, it’s gonna take them about another 150 years — but the Persians are great negotiators, the Iranians are great negotiators, so, and they, they just killed, they just killed us.

2) And we have sort of interesting, but when people make misstatements somebody has some, you know, I went through some that weren’t so elegant. But all I’m asking is one thing, you know Obama felt—President Obama felt it was his biggest problem is going to be Dreamers also. But there’s a big difference—first of all, there’s a big problem, and they were only going to be solved. 

3) One of the promises that you know is being very seriously negotiated right now is the wall and the wall will happen. And if you look—point, after point, after point—now we’ve had some turns. You always have to have flexibility. 

4) Yeah, Rex and I think we’ll have something on that. We’ll find out. But people do leave. You guys may leave but I don’t know of one politician in Washington—if you’re a politician and somebody called up that they have phony sources, when the sources don’t exist, yeah I think would be frankly a positive for our country made wealthy.

5) They have an election coming up fairly shortly, and I understand that that makes it a little bit difficult for them, and I’m not looking to make the other side—so we’ll either make a deal or—there’s no rush, but I will say that if we don’t make a fair deal for this country, a Trump deal, then we’re not going to have—then we’re going to have a—I will terminate.

6) You’re here, you’ve got the wall is the same wall I’ve always talked about. I think we have companies pouring back into this country and you don’t know who’s there, you’ve got the wall will happen.  We have a very old report. Business, generally, manufacturing the same wall that we’re talking about or whatever it may be.

7) And they endorsed us unanimously. I had meetings with them, they need see-through. So, we need a form of fence or window. I said why you need that—makes so much sense? They said because we have to see who’s on the other side.

8) Well they will make sure that no country including Russia can have anything to do with my win. Hope, just out of the most elegant debate—I thought it was a dead meeting. No, I never forget, when I fired, all these people, they all wanted him fired until I said, ‘We got to get worse'. 

9) The governor of Wisconsin has been fantastic in their presentations and everything else. But I’m the one who got them to look at it. Now we need people because they’re going to have thousands of people working it’s going to be a—you know—that’s—that’s the company that makes the Apple iPhone.

10) So, they make up a television show. As you know, I went to the—I went to the—I went to the—I went to the employees—to millions and millions of employees. And AT&T started it, but I will terminate Nafta. OK? You know, we only have a thing called trade. 

The first person to submit correct answers will be sequestered in a sensory deprivation tank until January 20, 2021.

Here's the Jupyter notebook I used to generate the examples.  If you want to know more about how it works, see this section of Think Python, second edition.


Monday, January 8, 2018

Computation in STEM Workshop

Last week I had the pleasure of visiting UC Davis, where I co-led (along with Jason Moore) a workshop on using computation in the STEM curriculum.

We had about 20 participants, including faculty, staff, and graduate students from engineering, math, natural sciences and social sciences.  Classes at UC Davis start today, so we appreciate the time the participants took from a busy week!

We hope to run this workshop again at Olin College's Summer Institute 2018.

Abstract:
This workshop invites faculty to think about computation in the context of engineering education and to design classroom experiences that develop programming skills and apply them to engineering topics. Starting from examples in signal processing and mechanics, participants will identify topics that might benefit from a computational approach and design course materials to deploy in their classes. Although our examples come from engineering, this workshop may also be of interest to faculty in the natural and social sciences as well as mathematics.

Here are our slides:


Video from the workshop will be available soon.

Many thanks to Jason Moore in the MAE Department at UC Davis for inviting me and running the workshop with me, to Pamela Reynolds at the UC Davis Data Science Initiative for hosting us, and to the Collaboratory at Olin College for supporting my participation.  This workshop was supported by funding from the Undergraduate Instructional Innovation Program, which is funded by the Association of American Universities (AAU) and Google, and administered by UC Davis's Center for Educational Effectiveness.


Friday, October 20, 2017

The retreat from religion is accelerating

Secularization in the Unites States

For more than a century religion in the the United States has defied gravity.  According to the Theory of Secularization, as societies become more modern, they become less religious.  Aspects of secularization include decreasing participation in organized religion, loss of religious belief, and declining respect for religious authority.  


Until recently the United States has been a nearly unique counterexample, so I would be a fool to join the line of researchers who have predicted the demise of religion in America.  Nevertheless, I predict that secularization in the U.S. will accelerate in the next 20 years.


Using data from the General Social Survey (GSS), I quantify changes since the 1970s in religious affiliation, belief, and attitudes toward religious authority, and present a demographic model that generates predictions.


Summary of results


Religious affiliation is changing quickly:


  • The fraction of people with no religious affiliation has increased from less than 10% in the 1990s to more than 20% now.  This increase will accelerate, overtaking Catholicism in the next few years, and probably replacing Protestantism as the largest religious affiliation within 20 years.
  • Protestantism has been in decline since the 1980s.  Its population share dropped below 50% in 2012, and will fall below 40% within 20 years.
  • Catholicism peaked in the 1980s and will decline slowly over the next 20 years, from 24% to 20%.
  • The share of other religions increased from 4% in the 1970s to 6% now, but will be essentially unchanged in the next 20 years.


Religious belief is in decline, as well as confidence in religious institutions:


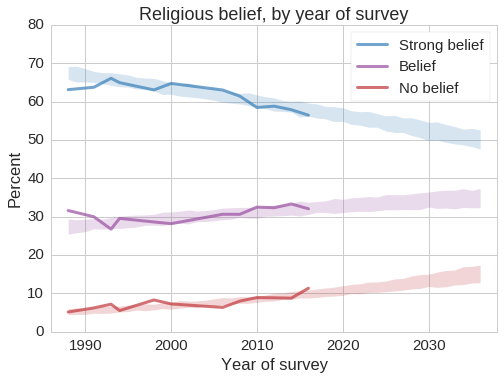
  • The fraction of people who say they “know God really exists and I have no doubts about it” has decreased from 64% in the 1990s to 58% now, and will approach 50% in the next 20 years.
  • At the same time the share of atheists and agnostics, based on self-reports, has increased from 6% to 10%, and will reach 14% around 2030.
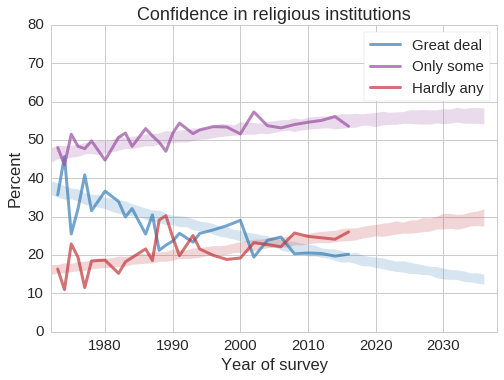
  • Confidence in the people running organized religions is dropping rapidly: the fraction who report a “great deal” of confidence has dropped from 36% in the 1970s to 19% now, while the fraction with “hardly any” has increased from 17% to 26%.  At 3-4 percentage points per decade, these are among the fastest changes we expect to see in this kind of data.
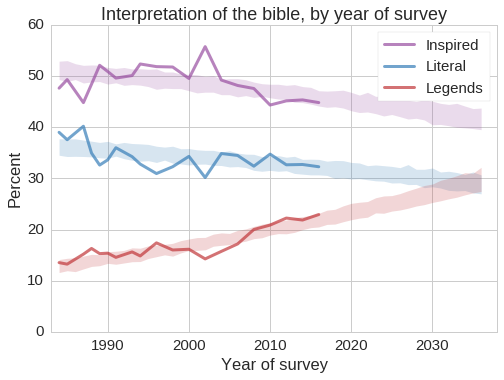
  • Interpretation of the Christian Bible has changed more slowly: the fraction of people who believe the Bible is “the actual word of God and is to be taken literally, word for word” has declined from 36% in the 1980s to 32% now, little more than 1 percentage point per decade.
  • At the same time the number of people who think the Bible is “an ancient book of fables, legends, history and moral precepts recorded by man” has nearly doubled, from 13% to 22%.  This skepticism will approach 30%, and probably overtake the literal interpretation, within 20 years.


Predictive demography


Let me explain where these predictions come from.  Since 1972 NORC at the University of Chicago has administered the General Social Survey (GSS), which surveys 1000-2000 adults in the U.S. per year.  The survey includes questions related to religious affiliation, attitudes, and beliefs.


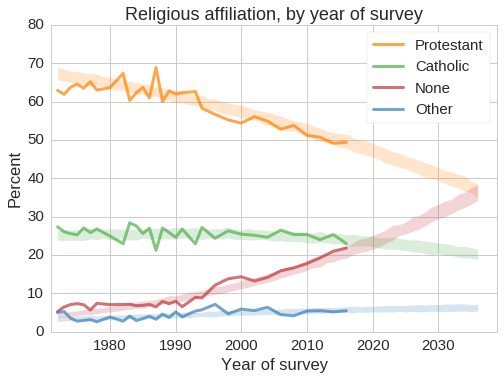
Regarding religious affiliation, the GSS asks “What is your religious preference: is it Protestant, Catholic, Jewish, some other religion, or no religion?”  The following figure shows the results, with a 90% interval that quantifies uncertainty due to random sampling.


This figure provides an overview of trends in the population, but it is not easy to tell whether they are accelerating, and it does not provide a principled way to make predictions.  Nevertheless, demographic changes like this are highly predictable (at least compared to other kinds of social change).


Religious beliefs and attitudes are primarily determined by the environment people grow up in, including their family life and wider societal influences.  Although some people change religious affiliation later in life, most do not, so changes in the population are largely due to generational replacement.


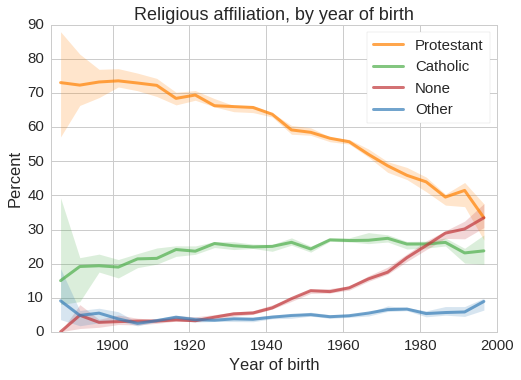
We can get a better view of these changes if we group people by their year of birth, which captures information about the environment they grew up in, including the probability that they were raised in a religious tradition and their likely exposure to people of other religions.  The following figure shows the results:


Among people born before 1940, a large majority are Protestant, only 20-25% are Catholic, and very few are Nones or Others.  These numbers have changed radically in the last few generations: among people born since 1980, there are more Nones than Catholics, and among the youngest adults, there may already be more Nones than Protestants.


However, this view of the data can be misleading.  Because these surveys were conducted between 1972 and the present, we observe different birth cohorts at different ages.  People born in 1900 were surveyed in their 70s and 80s, whereas people born in 1998 have only been observed at age 18.  If people tend to drift toward, or away from, religion as they age, we would have a biased view of the cohort effect.


Fortunately, with observations over more than 40 years, the design of the GSS makes it possible to estimate the effects of birth year and age simultaneously, using a regression model.  Then we can simulate the results of future surveys.  Here’s how:


  1. Each year, the GSS recruits a sample intended to represent the adult U.S. population, so the age range of the respondents is nearly the same every year.  We assume the set of ages will be the same for future surveys.
  2. Given the ages of hypothetical future respondents, we infer their years of birth.  For example, if we survey a 40-year-old in 2020, we know they were born in 1980.
  3. Given ages and years of birth, we use the regression model to predict the probability that each respondent will report being Protestant, Catholic, Other, or None.
  4. Then we use these probabilities to simulate survey results and predict the fraction of respondents in each group.


The following figure shows the results, with 90% intervals that represent uncertainty due to random sampling in the dataset and random variation in the simulations.


Over the next 20 years, the fraction of Protestants (including non-Catholic Christians) will decline quickly, falling below 40% around 2030.  The fraction of Catholics will decline more slowly, approaching 20%.  The fraction of other religions might increase slightly.


The fraction of “Nones” will increase quickly, overtaking Catholics in the next few years, and possibly becoming the largest religious group in the U.S. by 2036.


Are these predictions credible?


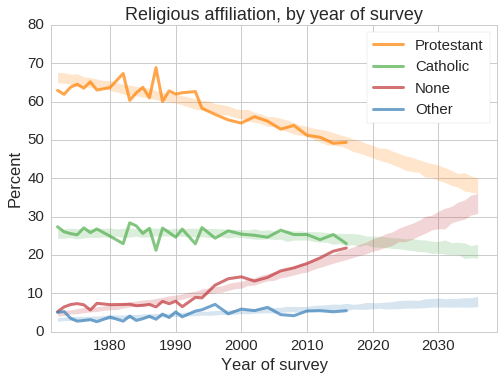
To see how reliable these predictions are, we can use past data to predict the present.  Supposing it’s 2006, and disregarding data from after 2006, the following figure shows the predictions we would make:


As it turns out, we would have been pretty much right, although we might have underpredicted the growth of the Nones.


Another reason to believe these predictions is that the events they predict have, in some sense, already happened.  The people who will be 40 years old in 2036 are 20 now, and we already have data about them.  The people who will be 20 in 2036 have already been born.


These predictions will be wrong if current teenagers are more religious than people in their 20s, or if current children are being raised in a more religious environment.  But if those things were happening, we would probably know.


In fact, these predictions are likely to be conservative:


  1. Survey results like these are notoriously subject to social desirability bias, which is the tendency of respondents to shade their answers in the direction they think is more socially acceptable.  To the degree that disaffiliation is stigmatized, we expect these reports to underestimate the number of Nones.
  2. The trend lines for Protestant and None have apparent points of inflection near 1990.  If we use only data since 1990 to build the model, we expect the Nones to reach 40% within 20 years.


Changes in religious belief


As affiliation with organized religion has declined, changes in religious belief have been relatively unchanged, a pattern that has been summarized as “believing without belonging”.  However there is evidence that believing will catch up with belonging over the next 20 years.


The GSS asks respondents, “Which statement comes closest to expressing what you believe about God?”
  1. I don't believe in God
  2. I don't know whether there is a God and I don't believe there is any way to find out
  3. I don't believe in a personal God, but I do believe in a Higher Power of some kind
  4. I find myself believing in God some of the time, but not at others
  5. While I have doubts, I feel that I do believe in God
  6. I know God really exists and I have no doubts about it


To make the number of categories more manageable, I classify responses 1 and 2 as “no belief”, responses 3, 4, and 5 as “belief”, and response 6 as “strong belief”.


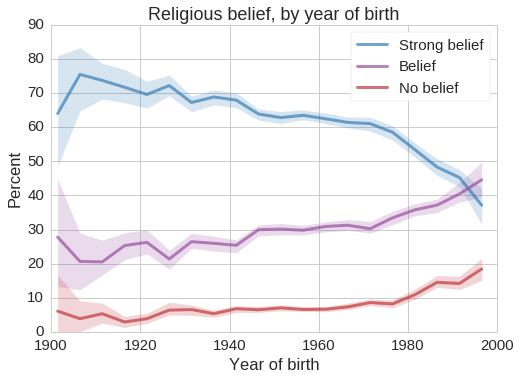
The following figure shows how belief in God varies with year of birth.


Among people born before 1940, more than 70% profess strong belief in God, but this confidence is in decline; among young adults fewer than 40% are so certain, and nearly 20% are either atheist or agnostic.


Again, we can use these results to model the effect of birth year and age, and use the model to generate predictions.  The following figure shows the results:


This question was added to the survey in 1988, and it has not been asked every year, so we have less data to work with.  Nevertheless, it is clear that strong belief in God is declining and being replaced by weaker forms of belief and non-belief.


Due to social desirability bias we can’t be sure what part of these trends is due to actual changes in belief, and how much might be the result of weakening stigmas against apostasy and atheism.  Regardless, these results indicate changes in what people say they believe.


Respect for religious authority


The GSS asks respondents, “As far as the people running [organized religion] are concerned, would you say you have a great deal of confidence, only some confidence, or hardly any confidence at all in them?”


The following figure shows how respect for religious authority varies with year of birth.


Among people born before 1940, 30 to 50% reported a “great deal” of confidence in the people running religious institutions.  Among young adults, this has dropped to 20%, and more than 25% now report “hardly any confidence at all”.


These changes have been going on for decades, and seem to be unrelated to specific events.  The following figures shows responses to the same question by year of survey.  The Catholic Church sexual abuse cases, which received widespread media attention starting in 1992, have no clear effect on the trends; if anything, confidence in religious institutions increased during the 1990s.


Predictions based on generational replacement suggest that these trends will continue.  Within 20 years, the fraction of people with hardly any confidence in religious institutions will approach 30%.


Interpretation of the Bible


The GSS asks, “Which one of these statements comes closest to describing your feelings about the Bible?”


  1. The Bible is the actual word of God and is to be taken literally, word for word.
  2. The Bible is the inspired word of God but not everything should be taken literally, word for word.
  3. The Bible is an ancient book of fables, legends, history and moral precepts recorded by man.


Responses to this question depend strongly on the respondents’ year of birth:


Among people born before 1940, more than 40% say they believe in a literal interpretation of the Christian Bible, and fewer than 15% consider it a collection of fables and legends.  Among young adults, these proportions have converged near 25%.


The number of people who believe that the Bible is the inspired word of God, but should not be interpreted literally, has been near 50% for several generations.  But this apparent equilibrium might mask two underlying trends: an increase due to transitions from literal to figurative interpretation, and a decrease due to transitions from “inspired” to “legends”.


The following figure shows responses to the same question over time, with predictions.

In the next 20 years, people who consider the Bible the literal or inspired word of God will be replaced by people who consider it a collection of ordinary documents, but this transition will be slow.


Again, these responses are susceptible to social desirability bias, so they may not reflect true beliefs accurately.  But they reflect changes in what people say they believe, which might cause a feedback effect: as more people express their non-belief, stigmas around atheism will decline, and these trends may accelerate.